Building a Complete Monitoring Stack on Kubernetes with Prometheus, Loki, and Grafana
If you’d like to explore all the manifests and Helm values used in this guide, check out the GitHub repository.
Running applications on Kubernetes without observability means operating blind. When something goes wrong, the impact is not just technical. For example, in an e-commerce platform, a failing payment gateway or a latency spike during a traffic peak means lost orders, frustrated customers, and eroded trust. The difference between detecting a problem in seconds versus minutes can be the difference between a brief incident and a wave of abandoned carts.
To address this, we will deploy a complete monitoring stack on Kubernetes that covers the three pillars of observability: Prometheus for metrics collection, Loki for log aggregation, and Grafana for visualization, with Alloy handling log shipping and Alertmanager routing alerts to Slack. A fake e-commerce application is deployed alongside the stack, continuously generating realistic metrics and structured logs such as orders, payments, inventory levels, and HTTP traffic. This gives the monitoring layer something meaningful to work with from the start and makes every configuration immediately verifiable.
Table of Contents
- Architecture Overview
- Deploying the Application
- Deploying the Observability Stack
- Connecting Metrics, Logs and Alerts
- Validation
- Conclusion
Architecture Overview
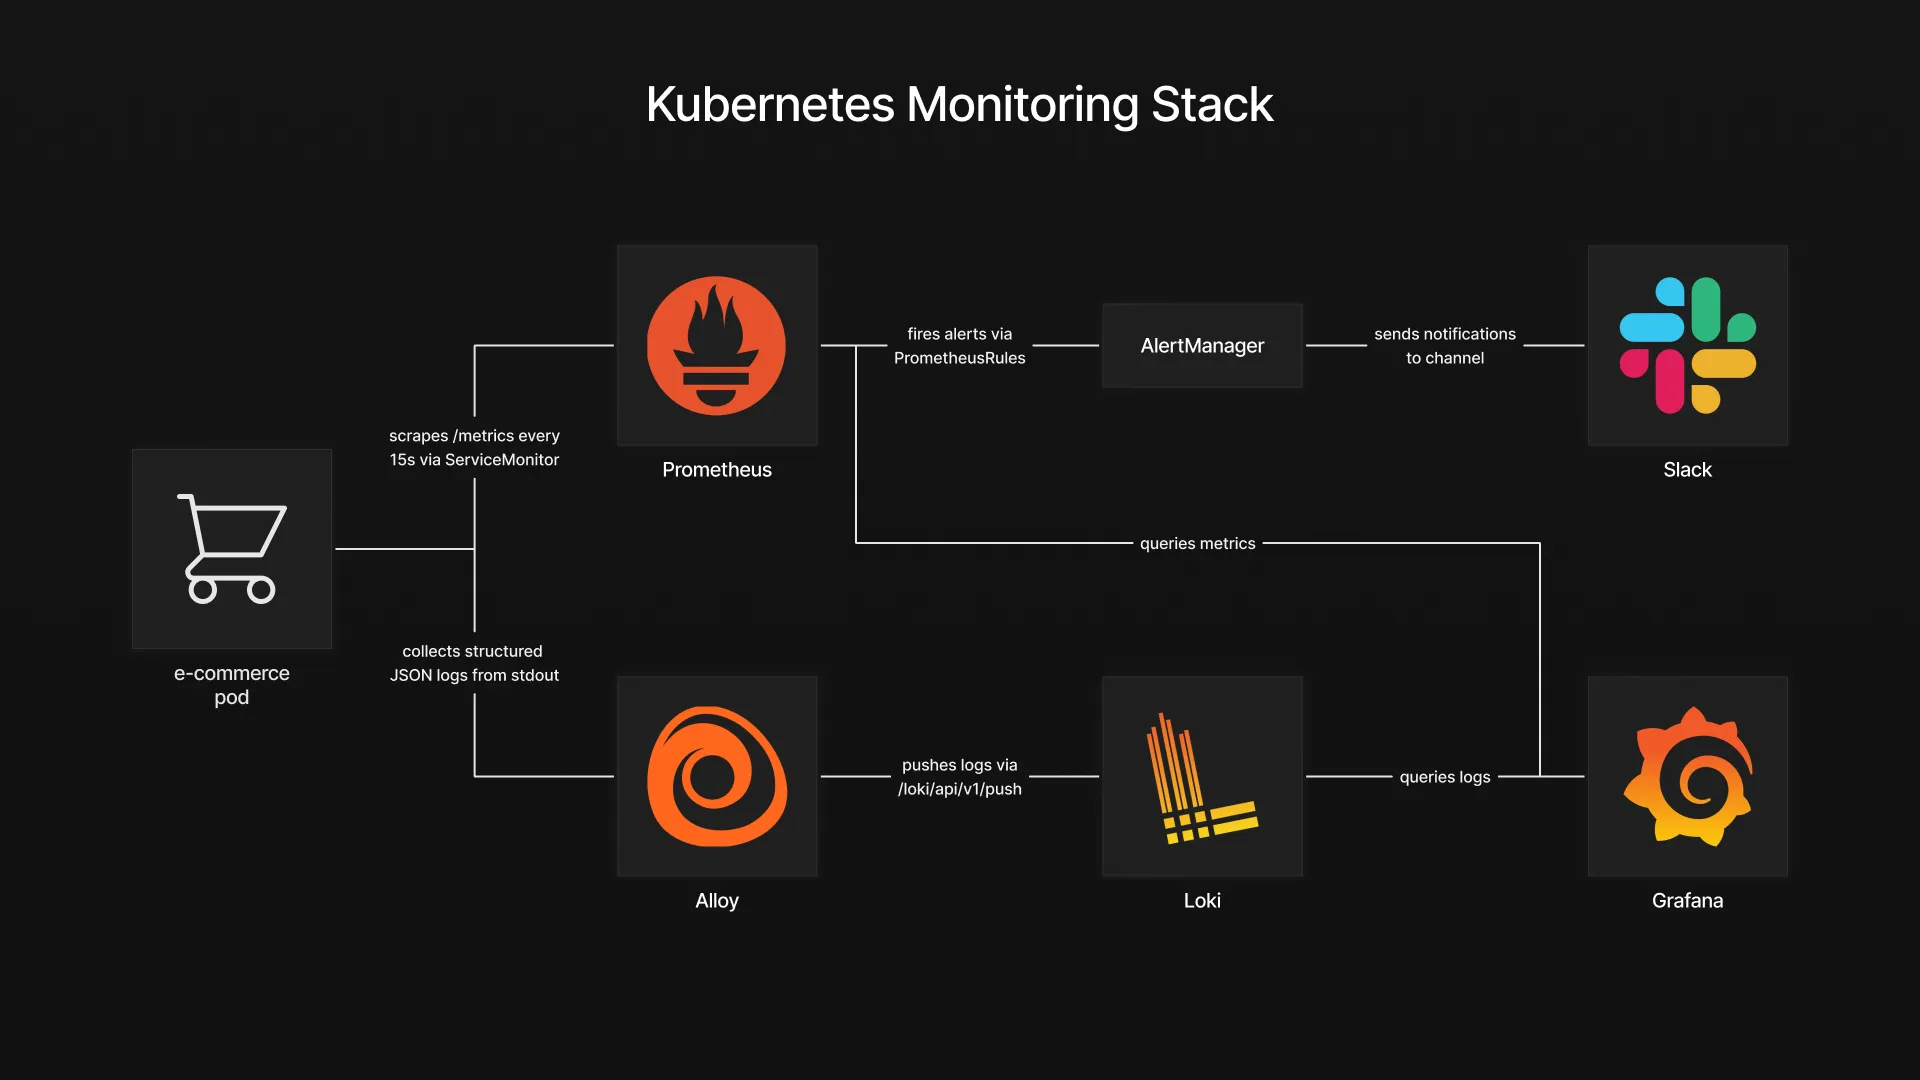
The stack is built around two data flows that converge in Grafana. On the metrics side, the fake e-commerce application exposes a /metrics endpoint in Prometheus format. A ServiceMonitor tells Prometheus where to scrape, and Prometheus collects the data at regular intervals. On the logs side, the application writes structured JSON logs to stdout. These logs are collected by Grafana Alloy, which runs as a DaemonSet on every node, discovers pods through the Kubernetes API, and ships their log streams to Loki.
Grafana sits at the center as the visualization layer. It queries Prometheus for metrics and Loki for logs, allowing both data sources to be combined in a single dashboard. This means a spike in payment errors on a time series panel can be correlated with the actual error logs right next to it, without switching tools.
For alerting, PrometheusRules define the conditions that should trigger an alert, such as a high payment failure rate or low inventory levels. When a rule fires, Prometheus forwards the alert to Alertmanager, which handles grouping, deduplication, and routing. In this setup, alerts are sent to a Slack channel, giving the team immediate visibility when something requires attention.
Deploying the Application
Before setting up the monitoring stack, we need something to monitor. The fake e-commerce application is a lightweight container that simulates realistic e-commerce activity. It exposes a /metrics endpoint with Prometheus-formatted metrics such as order rates, payment errors, checkout latency, and inventory levels. It also emits structured JSON logs to stdout, covering events like successful orders, failed payments, and low stock warnings.
The application runs in its own namespace with a simple Deployment and a Service that exposes the metrics port.
kubectl create namespace fake-ecommerce
kubectl apply -f fake-ecommerce-app/
With the application running and generating data, we can now deploy the monitoring stack that will collect, store, and visualize it.
Deploying the Observability Stack
Loki
Loki is the log aggregation backend. Unlike traditional logging solutions that index the full content of every log line, Loki only indexes metadata labels such as namespace, pod, and container. The actual log content is stored compressed and queried on demand. This makes it significantly lighter to operate and a natural fit for Kubernetes environments where log volume can grow quickly.
The values file keeps the deployment minimal by disabling all distributed components and caching layers:
# loki-values.yaml
deploymentMode: SingleBinary

singleBinary:
  replicas: 1

write:
  replicas: 0
read:
  replicas: 0
backend:
  replicas: 0

chunksCache:
  enabled: false
resultsCache:
  enabled: false

test:
  enabled: false

loki:
  auth_enabled: false
  commonConfig:
    replication_factor: 1
  storage:
    type: filesystem
    filesystem:
      chunks_directory: /var/loki/chunks
      rules_directory: /var/loki/rules
  useTestSchema: true
For this setup, Loki runs in SingleBinary mode, meaning all components run in a single process with logs stored on the local filesystem. This keeps the deployment simple and self-contained, with no external dependency or authentication required.
kubectl create namespace monitoring
helm repo add grafana https://grafana.github.io/helm-charts
helm repo update
helm install loki grafana/loki \
  --namespace monitoring \
  --values helm-values/loki-values.yaml
Once Loki is running, it exposes a gateway service inside the cluster at http://loki-gateway. This is the endpoint that both Alloy and Grafana will use to push and query logs.
Alloy
Grafana Alloy is the log collection agent. Deployed as a DaemonSet, it runs on every node in the cluster, discovers pods through the Kubernetes API, and forwards their log streams to Loki. It replaces older agents like Promtail and provides a unified pipeline configuration using the Alloy configuration language.
The configuration defines a three-stage pipeline: discover pods, enrich the labels, and ship the logs to Loki.
# alloy-values.yaml
alloy:
  configMap:
    content: |
      discovery.kubernetes "pods" {
        role = "pod"
      }

      discovery.relabel "pods" {
        targets = discovery.kubernetes.pods.targets

        rule {
          source_labels = ["__meta_kubernetes_namespace"]
          target_label  = "namespace"
        }
        rule {
          source_labels = ["__meta_kubernetes_pod_name"]
          target_label  = "pod"
        }
        rule {
          source_labels = ["__meta_kubernetes_pod_container_name"]
          target_label  = "container"
        }
      }

      loki.source.kubernetes "pods" {
        targets    = discovery.relabel.pods.output
        forward_to = [loki.write.default.receiver]
      }

      loki.write "default" {
        endpoint {
          url        = "http://loki-gateway/loki/api/v1/push"
          tenant_id  = "1"
        }
      }
The discovery.kubernetes block discovers all pods in the cluster. The discovery.relabel stage extracts useful metadata like namespace, pod name, and container name into labels that will be queryable in Loki. Finally, loki.source.kubernetes reads the actual log streams and loki.write pushes them to the Loki gateway endpoint we deployed earlier.
helm install alloy grafana/alloy \
  --namespace monitoring \
  --values helm-values/alloy-values.yaml
At this point, logs from every pod in the cluster, including the fake e-commerce application, are being collected and stored in Loki.
Slack Webhook Setup
Before deploying the Prometheus stack, we need a Slack webhook URL so Alertmanager can send alerts to a channel.
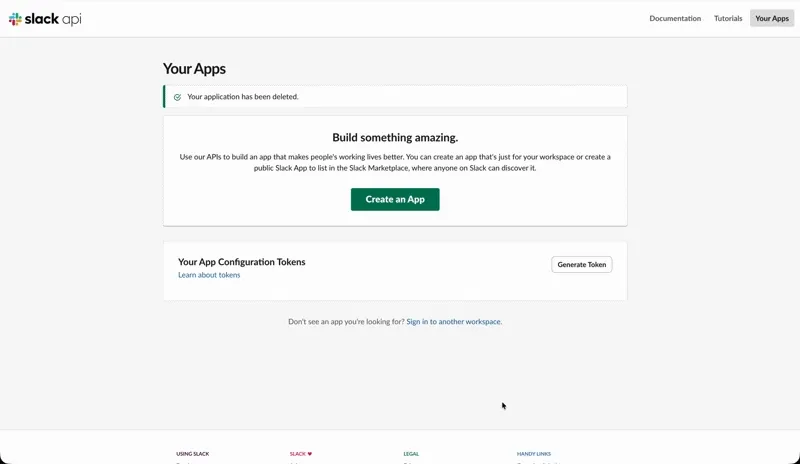
- Head over to the Slack app creation page and click Create New App
- Select From Scratch
- Set the app name to something like “Monitoring”, select your workspace, and click Create App
- On the app configuration page, click Incoming Webhooks
- Turn on Activate Incoming Webhooks
- Click Add New Webhook to Workspace
- Select the channel where you want alerts to appear and click Allow
- Copy the webhook URL and keep it aside
We will use this URL in the next section when configuring Alertmanager.
kube-prometheus-stack
The kube-prometheus-stack Helm chart bundles Prometheus, Grafana, and Alertmanager into a single deployment. It also installs the ServiceMonitor and PrometheusRule CRDs that we will use later to connect the application to the monitoring layer.
The values file covers three main configuration areas: Prometheus scraping behavior, Grafana access and datasources, as well as Alertmanager alert routing to Slack.
# kube-prometheus-stack-values.yaml
prometheus:
  enabled: true
  prometheusSpec:
    serviceMonitorSelectorNilUsesHelmValues: false
    serviceMonitorSelector: {}
    serviceMonitorNamespaceSelector: {}
    ruleSelector:
      matchExpressions:
        - key: prometheus
          operator: In
          values:
            - example-rules

grafana:
  sidecar:
    image:
      registry: docker.io
  assertNoLeakedSecrets: false
  adminPassword: <GRAFANA_ADMIN_PASSWORD>
  additionalDataSources:
    - name: Loki
      type: loki
      uid: loki
      url: http://loki-gateway.monitoring.svc.cluster.local
      access: proxy
      jsonData:
        httpHeaderName1: "X-Scope-OrgID"
      secureJsonData:
        httpHeaderValue1: "fake"

alertmanager:
  config:
    global:
      resolve_timeout: 5m
      slack_api_url: <SLACK_WEBHOOK_URL>
    route:
      group_by: ['job']
      group_wait: 30s
      group_interval: 5m
      repeat_interval: 12h
      receiver: 'slack'
      routes:
        - match:
            alertname: DeadMansSwitch
          receiver: 'null'
        - match:
          receiver: 'slack'
          continue: true
    receivers:
      - name: 'null'
      - name: 'slack'
        slack_configs:
          - channel: '<SLACK_CHANNEL>'
            send_resolved: true
            title: '[{{ .Status | toUpper }}{{ if eq .Status "firing" }}:{{ .Alerts.Firing | len }}{{ end }}] Monitoring Event Notification'
            text: >-
              {{ range .Alerts }}
                *Alert:* {{ .Annotations.summary }} - `{{ .Labels.severity }}`
                *Description:* {{ .Annotations.description }}
                *Details:*
                {{ range .Labels.SortedPairs }} • *{{ .Name }}:* `{{ .Value }}`
                {{ end }}
              {{ end }}
The Prometheus configuration disables the default Helm label filtering for ServiceMonitors, allowing it to pick up any ServiceMonitor across all namespaces. The ruleSelector targets PrometheusRules labeled with prometheus: example-rules, which is the label we will use when creating alert rules later.
Grafana is configured with Loki as an additional datasource pointing to the gateway service deployed earlier. The X-Scope-OrgID header is required because Loki expects a tenant ID, even when multi-tenancy is disabled.
Alertmanager uses the Slack webhook URL obtained in the previous step to route all firing alerts to the configured channel. The DeadMansSwitch alert, which fires continuously to confirm Alertmanager is alive, is routed to a null receiver to avoid noise. The Slack message template references fields like summary, description, and severity that we will define later when writing the alert rules.
Replace <GRAFANA_ADMIN_PASSWORD> with your chosen password, <SLACK_WEBHOOK_URL> with the webhook URL from the Slack app setup, and <SLACK_CHANNEL> with your channel name prefixed with # (for example #alerts).
helm repo add prometheus-community https://prometheus-community.github.io/helm-charts
helm repo update
helm install kube-prometheus-stack prometheus-community/kube-prometheus-stack \
  --namespace monitoring \
  --values helm-values/kube-prometheus-stack-values.yaml
With this deployment, the full monitoring stack is in place. Prometheus is scraping metrics, Loki is storing logs collected by Alloy, Grafana has both datasources configured, and Alertmanager is ready to forward notifications to Slack. The next step is to wire the fake e-commerce application into this stack.
Connecting Metrics, Logs and Alerts
ServiceMonitor
The monitoring stack is running, but Prometheus does not yet know about the fake e-commerce application. A ServiceMonitor is a custom resource that tells Prometheus which Service to scrape, on which port, and how often.
# service-monitor.yaml
apiVersion: monitoring.coreos.com/v1
kind: ServiceMonitor
metadata:
  name: fake-ecommerce
  namespace: monitoring
  labels:
    app.kubernetes.io/part-of: fake-ecommerce
    app.kubernetes.io/component: monitoring
spec:
  namespaceSelector:
    matchNames:
      - fake-ecommerce
  selector:
    matchLabels:
      app: fake-ecommerce
  endpoints:
    - port: metrics
      path: /metrics
      interval: 15s
The namespaceSelector points to the fake-ecommerce namespace where the application is running, and the selector matches the Service by its app: fake-ecommerce label. The endpoints section defines the scrape target: the port named metrics on the /metrics path, with a 15 second interval.
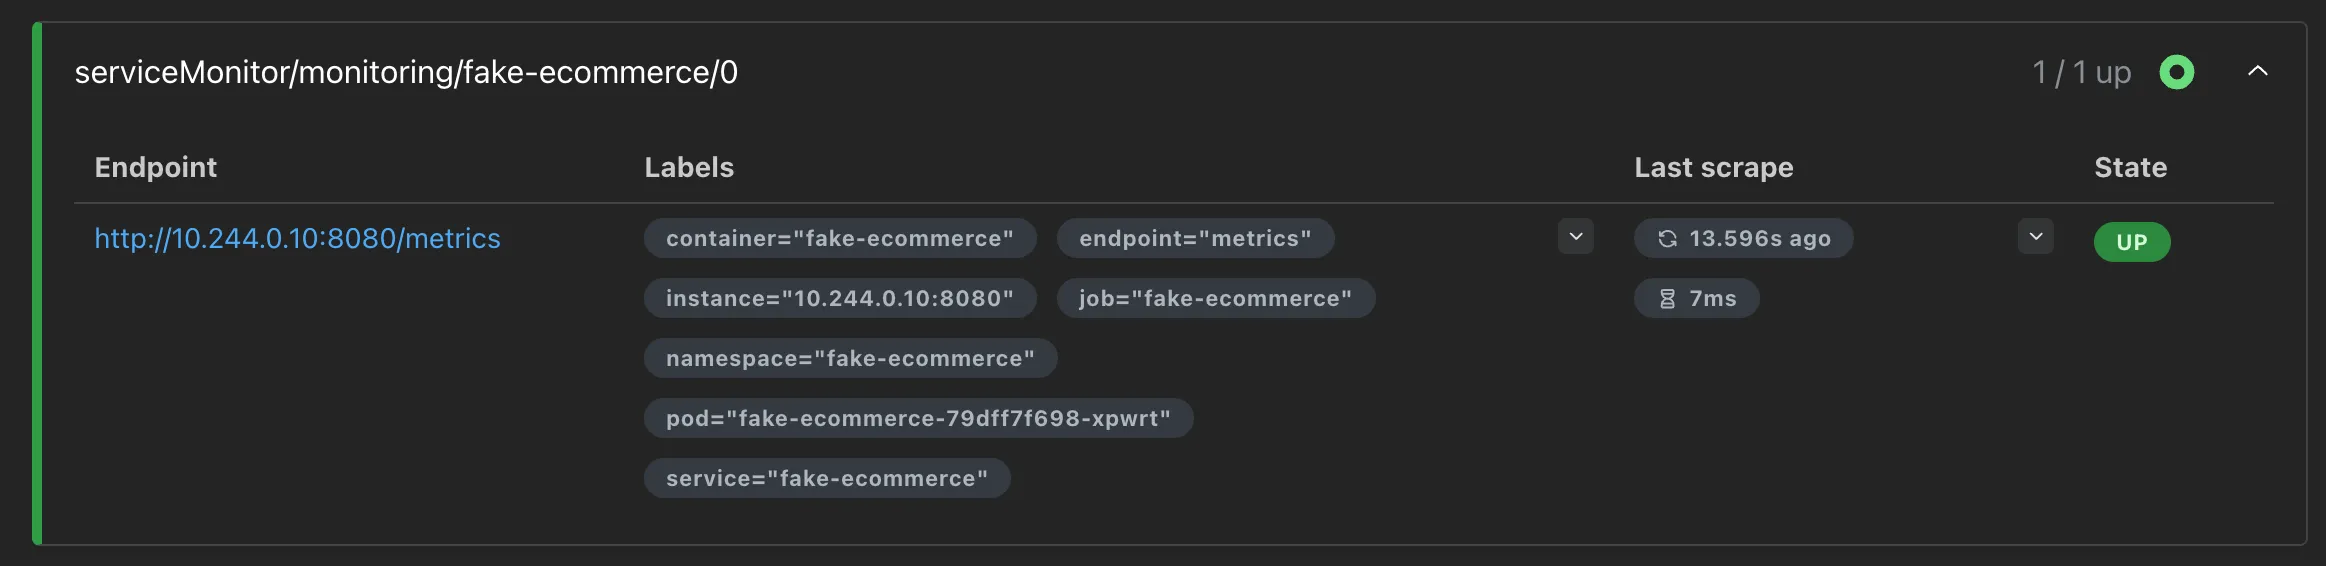
kubectl apply -f monitoring/service-monitor.yamlWithin a few seconds, Prometheus discovers the new target and starts collecting metrics from the application. To verify, expose the Prometheus UI and check the target health:
kubectl port-forward -n monitoring svc/kube-prometheus-stack-prometheus 9090:9090Open http://localhost:9090/targets in your browser. The fake-ecommerce target should appear with a status of UP.
PrometheusRules
With metrics flowing into Prometheus, we can now define alert rules that will fire when specific conditions are met. A PrometheusRule is a custom resource that contains PromQL expressions evaluated at regular intervals. When an expression returns a result for longer than the defined for duration, Prometheus fires the alert and forwards it to Alertmanager.
The following manifest defines four alerts covering the key areas of the e-commerce application:
# prometheus-rules.yaml
apiVersion: monitoring.coreos.com/v1
kind: PrometheusRule
metadata:
  labels:
    prometheus: example-rules
    role: alert-rules
  name: fake-ecommerce-alerts
  namespace: monitoring
spec:
  groups:
    - name: "fake-ecommerce.rules"
      rules:
        - alert: EcommerceHighPaymentFailureRate
          expr: sum(rate(ecommerce_payment_errors_total[2m])) / sum(rate(ecommerce_orders_total[2m])) > 0.10
          for: 30s
          labels:
            severity: critical
          annotations:
            summary: High payment failure rate
            description: "Payment failure rate is above 10% (current: {{ $value | humanizePercentage }})"

        - alert: EcommerceHighCheckoutLatency
          expr: histogram_quantile(0.95, sum(rate(ecommerce_checkout_duration_seconds_bucket[2m])) by (le)) > 2
          for: 30s
          labels:
            severity: warning
          annotations:
            summary: High checkout latency
            description: "Checkout p95 latency is above 2s (current: {{ $value | humanizeDuration }})"

        - alert: EcommerceLowInventory
          expr: ecommerce_inventory_level < 5
          for: 30s
          labels:
            severity: warning
          annotations:
            summary: Low inventory
            description: "Product {{ $labels.product }} stock is critically low (current: {{ $value }})"

        - alert: EcommerceHighErrorRate
          expr: sum(rate(ecommerce_http_requests_total{status_code=~"5.."}[2m])) / sum(rate(ecommerce_http_requests_total[2m])) > 0.05
          for: 30s
          labels:
            severity: critical
          annotations:
            summary: High HTTP error rate
            description: "HTTP 5xx error rate is above 5% (current: {{ $value | humanizePercentage }})"
The labels on the metadata include prometheus: example-rules, which matches the ruleSelector we configured in the kube-prometheus-stack-values.yaml. Without this label, Prometheus would ignore the rules entirely.
Each rule follows the same structure. The expr field contains the PromQL expression that defines the condition. The for field sets how long the condition must hold before the alert fires, preventing false positives from brief spikes. The labels section attaches a severity level used by Alertmanager for routing decisions. The annotations provide the summary and description fields that appear in Slack notifications, which are the same fields referenced in the Alertmanager template we configured earlier.
The four alerts cover payment failure rates exceeding 10%, checkout p95 latency above 2 seconds, inventory dropping below 5 units for any product, and HTTP 5xx error rates above 5%. To demonstrate this behavior, the fake e-commerce application runs on a 10-minute cycle alternating between normal operation and anomaly phases. Each phase lasts 2 minutes, generating enough data for the PromQL expressions to detect issues within their rate windows, causing all four alerts to fire over the course of a single cycle.
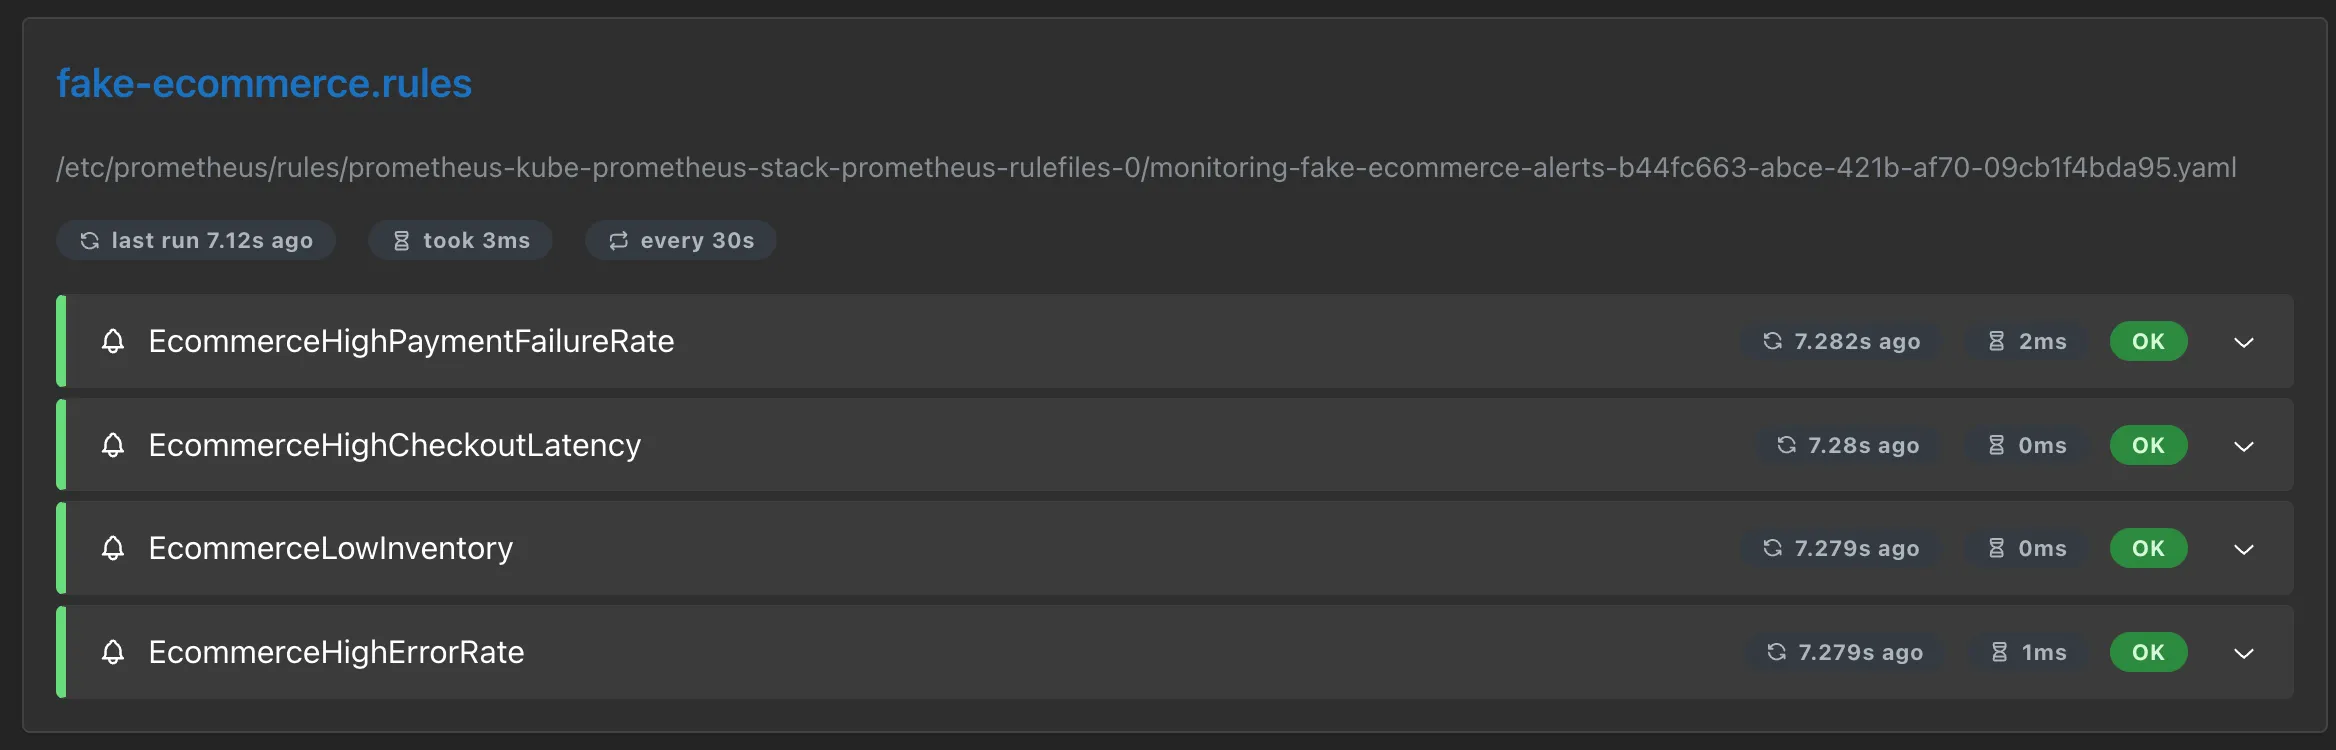
kubectl apply -f monitoring/prometheus-rules.yamlTo verify that Prometheus has picked up the rules, open http://localhost:9090/rules in the Prometheus UI. The fake-ecommerce.rules group should appear with all four alert definitions.
Grafana Dashboard
The last piece is a Grafana dashboard that brings metrics and logs together in a single view. Rather than building it manually through the Grafana UI, the dashboard is defined as a JSON file and deployed through a ConfigMap. Grafana’s sidecar automatically detects ConfigMaps with the label grafana_dashboard: “1” and loads them on the fly.
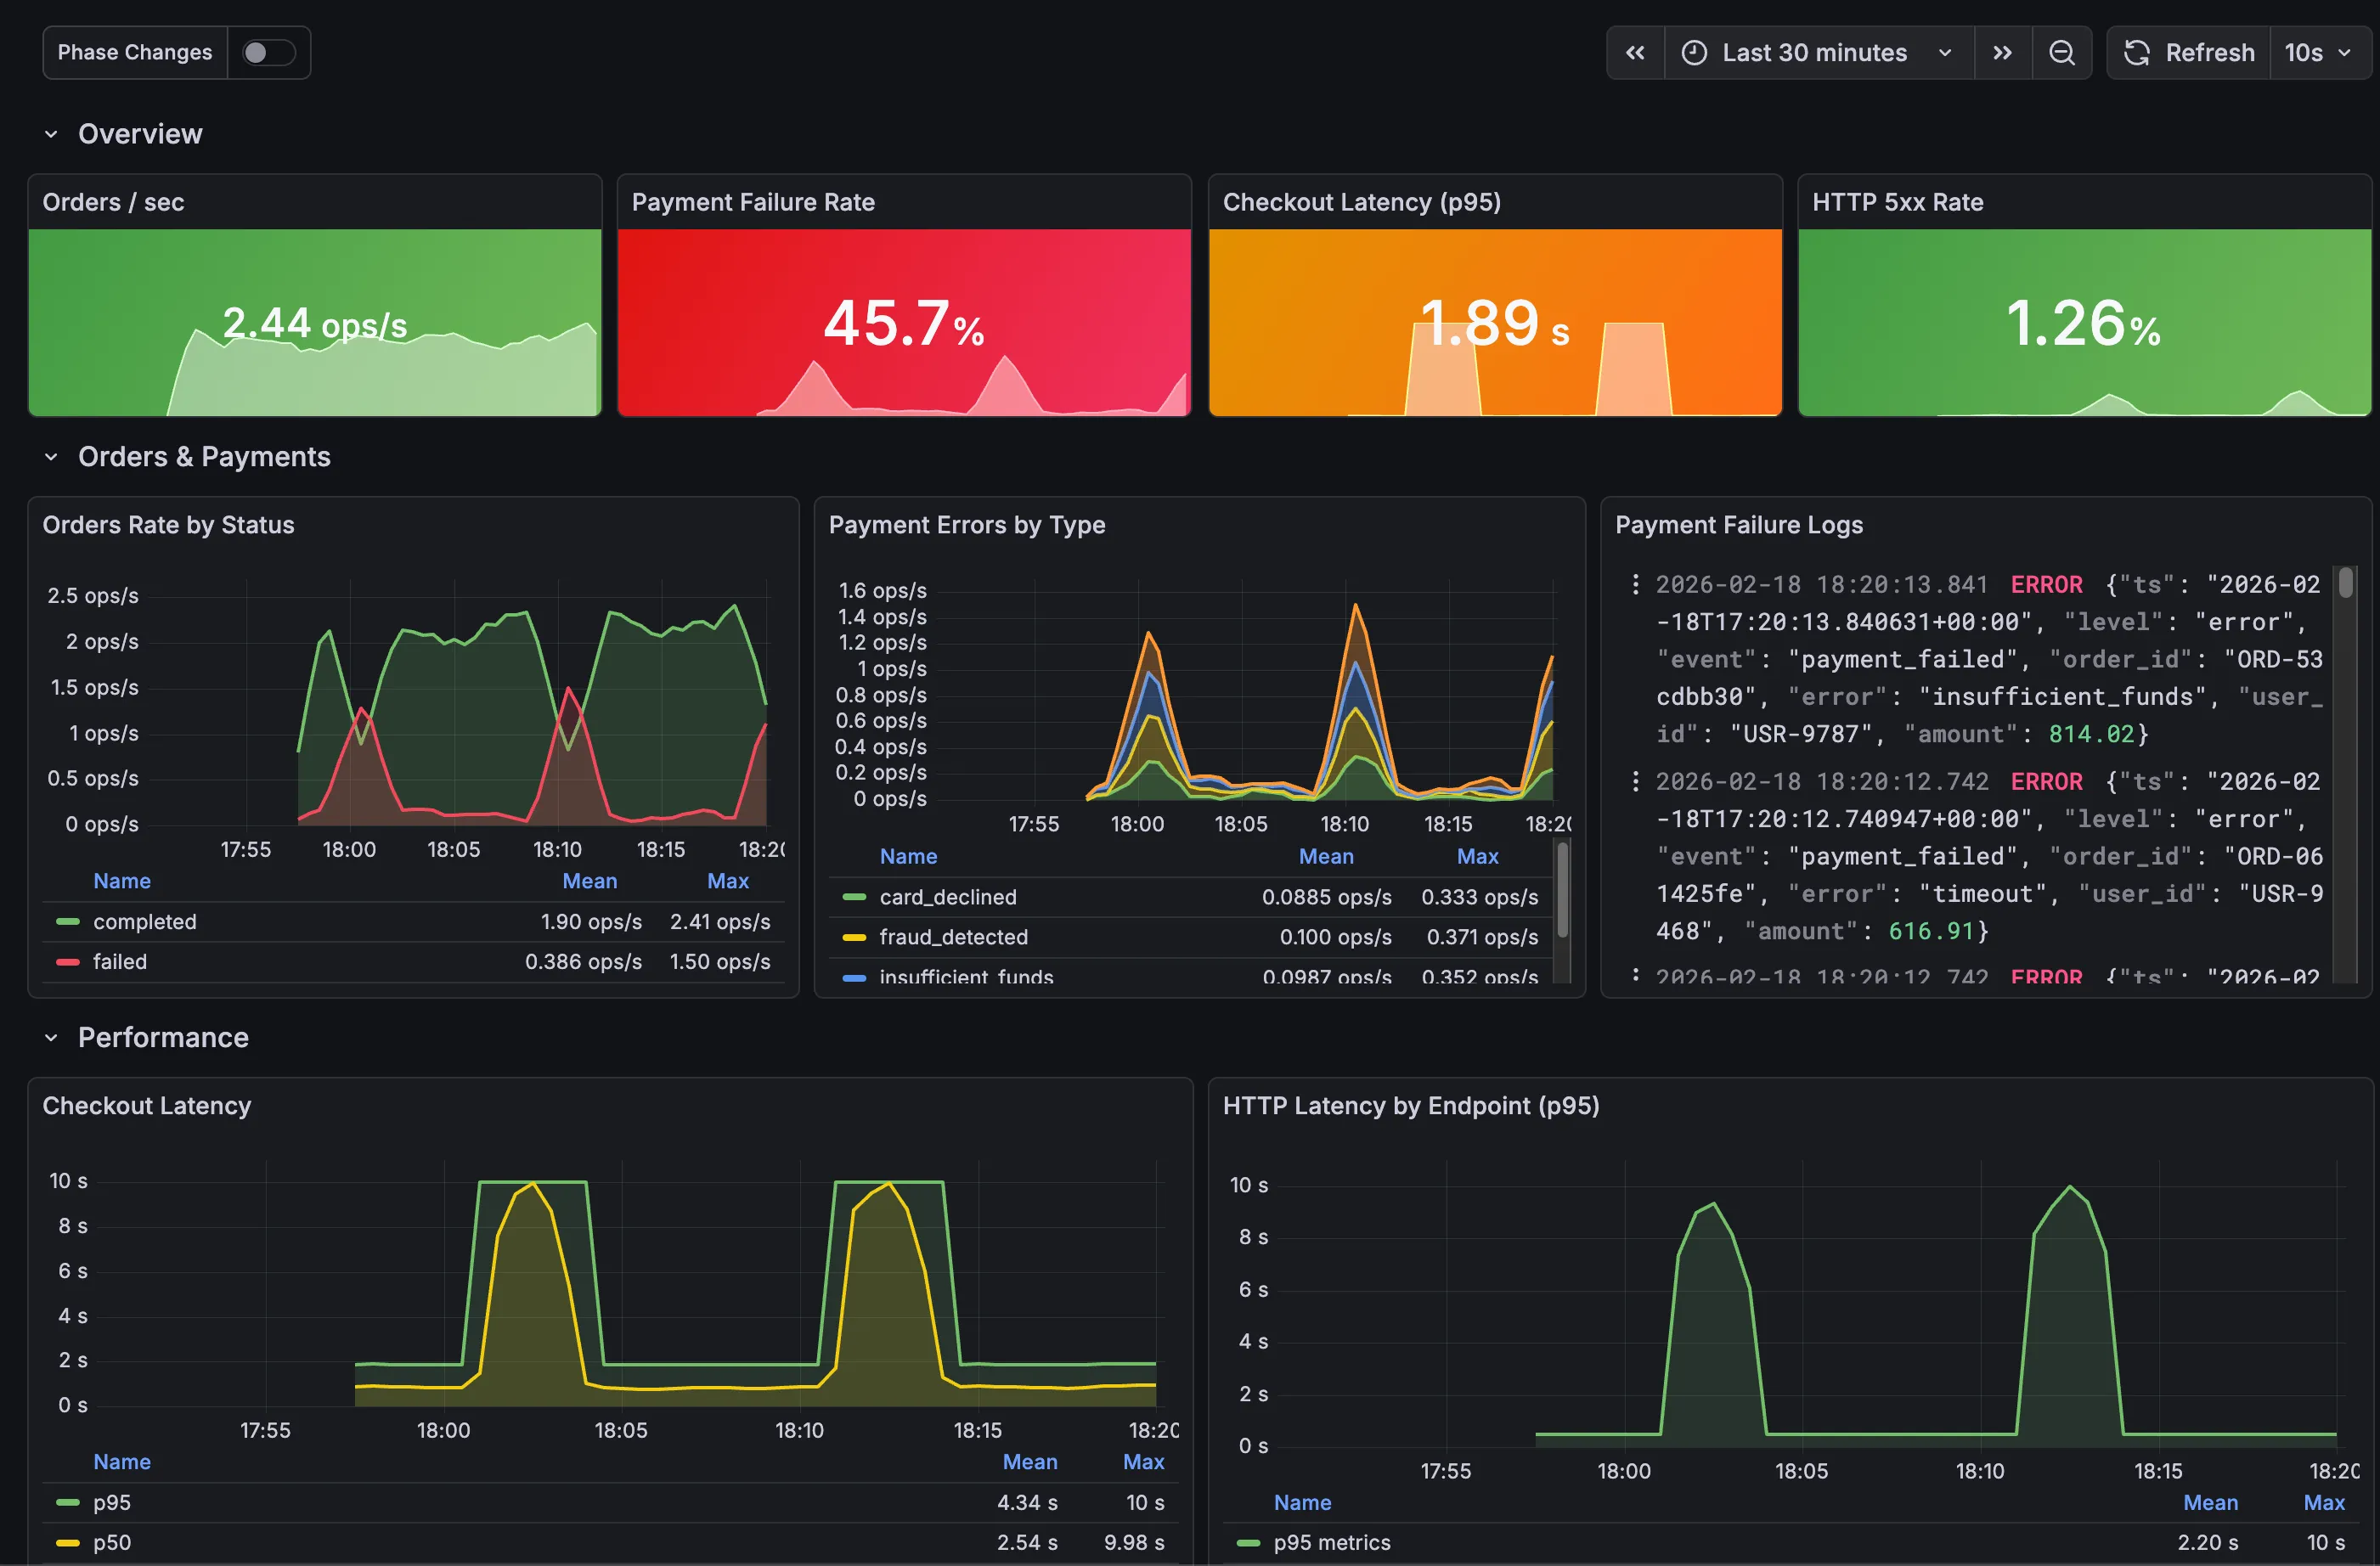
The dashboard JSON itself is too large to include inline, but it is available in the repository under monitoring/grafana-dashboard-configmap.yaml. It is organized into multiple sections that group related metrics and logs by functional area, providing a structured overview of the application’s behavior. Each row combines Prometheus metric panels with Loki log panels side by side, making it possible to correlate metric changes with the corresponding log entries without leaving the dashboard.
kubectl apply -f monitoring/grafana-dashboard-configmap.yamlGrafana picks up the dashboard within a few seconds. We can now validate that the entire stack is working end to end.
Validation
To verify the stack is working end to end, expose Grafana and check the dashboard:
kubectl port-forward -n monitoring svc/kube-prometheus-stack-grafana 3000:80Open http://localhost:3000 and log in with admin as the username and the password you defined in the kube-prometheus-stack-values.yaml. In the left sidebar, navigate to Dashboards. The Fake E-commerce dashboard should appear in the list. Open it to see metrics and logs updating in real time as the application cycles through its different phases.
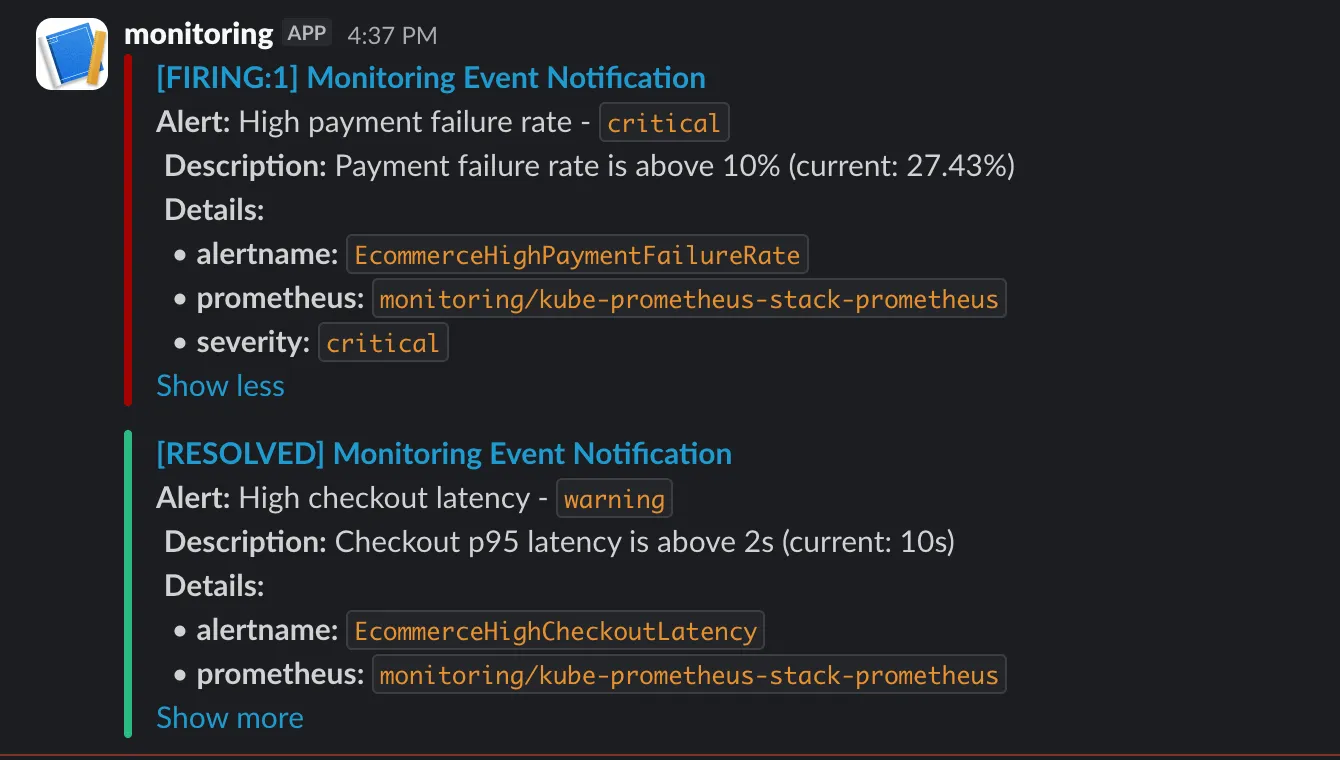
After a few minutes, the application enters its anomaly phases and alerts start firing. Alertmanager groups them and forwards the notifications to Slack. Messages appear in the configured channel under the name of the Slack app created earlier, with the alert summary, description, and severity labels.
Conclusion
This stack provides the foundations for observability on Kubernetes: metrics with Prometheus, logs with Loki and Alloy, alerting with Alertmanager and Slack, and a unified dashboard in Grafana that correlates both data sources. A production setup would involve switching Loki to object storage, enabling Prometheus high availability, adding TLS, and refining alert thresholds based on real traffic patterns.
But even at this stage, the core value is already there. A payment failure spike, a latency degradation, or a depleting inventory is no longer something that goes unnoticed until customers start complaining. It surfaces in a dashboard, triggers an alert, and reaches the team in seconds.